Costing
15.1. SPREAD OF EDUCATION 15.2. BUDGETARY ALLOCATION AND EXPENDITURE TRENDS 15.3. THE MODEL 15.4. BUDGETARY IMPACT 15.5. COMMITMENTS FROM DEVELOPMENT PARTNERS 15.6. CALCULATING BUDGETARY GAPS 15.7. PROGRAM WISE COMMITMENT 15.8. CHALLENGE AND SUSTAINABILITY 15.9. KEY ASSUMPTIONS FOR FINANCING
15. Costing
Financial outlays of Rs. 72.75 billion have been estimated for the implementation of BESP 2020-25. This amount will be over and above the current budgetary allocations. The financing needs of BESP 2020-25 will be met primarily through public funds, although efforts will also be made to mobilise donor support. Looking at present trends – based on past expenditure growths, a deficit of Rs. 21.48 billion is likely to be encountered over the five-year period. Government of Balochistan is committed to cover this gap through its own resources, as well as, procurement of funds or technical assistance from the development partners.
This chapter estimates the budgetary outlays needed for the implementation of BESP. Figures have been reached through an elaborate simulation model built within the limitations of data available. This chapter explains the details of costing. It begins with an overview of the education budget and expenditure pattern of the last five years. It then explains the details of the simulation model with a particular focus on the total funding requirement, likely financing gaps, challenges and sustainability options. Finally, this chapter also highlights the set of assumptions on which successful availability of these funds depends over the next five years.
Spread of Education
15.1. Spread of Education
Spread of education recurrent budget goes beyond the Secondary Education Department (SED). Its spread is as follows:
Table 15-1 Department Allocation as % of Total Education Recurrent Budget
|
Department |
Allocation (PKR
in billion) |
Allocation as % of Total
Education Budget |
Allocation as % of Total Balochistan Recurrent Budget |
|
Secondary Education (including BEF
Community Schools) |
48.01 |
|
16.35% |
|
Higher Education (Including BRC, Cadet
Colleges and Military College Sui) |
10.13 |
21.10% |
3.45% |
|
Medical Education |
3.78 |
7.87% |
1.29% |
|
Social Welfare Department - Nonformal
Education (NFE) |
0.11 |
0.23% |
0.04% |
|
Social Welfare Department - Special
Education and Child Protection |
0.49 |
1.02% |
0.17% |
|
Industries Department – TVET |
0.57 |
1.18% |
0.19% |
|
Labour & Manpower Department - TVET |
1.26 |
2.63% |
0.43% |
|
Mines and Minerals – Education |
0.15 |
0.31% |
0.05% |
|
Source: Budget Book 2019-20 |
|||
Budgetary Allocation and Expenditure Trends
15.2. Budgetary Allocation and Expenditure Trends
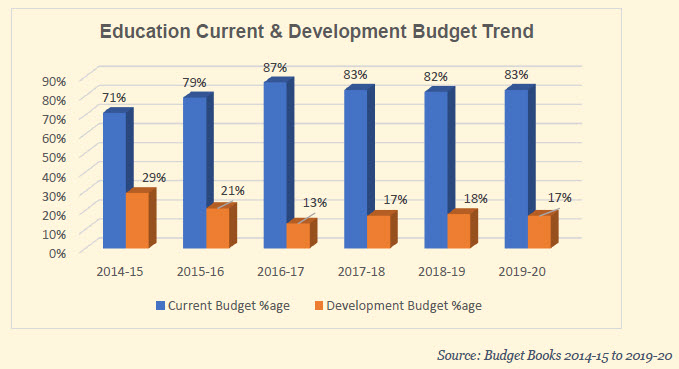
Education budget is split between recurrent and development expenditures. Recurrent expenditures (or the current budget) constitute the bulk of the budget. Figure 15-1 shows the split for the budget of Secondary Education Department, Higher Education and Medical Education. Trend for others, though not seen here, has a higher percentage of recurrent portion. As seen in Figure 15-1 the trend for these three show that current budgets constitute on average from 71% to 83% of the total. This is not unusual for budgets. However, there has been a decline in the development budget from a peak of 29% in 2014-15 to 17% though up from the lowest point of 13% in 2016-17.
Figure 15-1 Education Current and Development Budget Trend 2014-2019
The bulk of education budget, at 78%, is allocated to the Secondary Education Department, followed by 16% to higher education and 6% to medical education.
Current budgets are almost always spent. Almost 90% of current budget consists of salaries. Expenditure issues sometimes appear in development budgets. Table 15-2 shows that for most years, at all levels, utilisation has been lower than allocation with 2016-17 being an exception. Main reasons for low utilisation include a combination of weak capacity at the spending level, inefficient release processes, unavailability of the budgeted amount and, sometimes, re-allocation to other areas.
Table 15-2 Table of utilisation of development funds
|
Utilisation of development education budget
(%) |
|||||||
|
SECTOR |
2012-13 |
2013-14 |
2014-15 |
2015-16 |
2016-17 |
2017-18 |
2018-19 |
|
PRIMARY (GOB) |
58 |
87 |
66 |
83 |
157 |
52 |
14 |
|
MIDDLE (GOB) |
75 |
268 |
65 |
92 |
227 |
63 |
2 |
|
SECONDARY (GOB) |
42 |
86 |
84 |
116 |
311 |
47 |
31 |
|
COLLEGE |
81 |
60 |
67 |
101 |
171 |
96 |
80 |
|
GENERAL |
80 |
18 |
24 |
122 |
161 |
33 |
163 |
|
TECHNICAL |
33 |
39 |
|
76 |
100 |
100 |
|
|
Source:
Development Budget 2011-2018 |
|||||||
Table 15-2 does not include development budgets of Balochistan Textbook Board and Balochistan Board of Intermediate and Secondary Education. The former receives a single line budget from the Department of Secondary Education while BBISE raises its own funds.
The Model
15.3. The Model
The simulation model used for estimating costs and financing gaps for BESP 2020-25 has been primarily divided into two types of costs:
I. Scale Costs
II. Non Scale Costs
Scale costs increase with additional enrolments. An example of scale costs are the expenditures on textbooks. Not all scale costs increase with each new child enrolled. The impact on costs with scales depends on the standards used. For example, this model assumes that a new teacher will be hired for every additional 40 children enrolled, provided the current capacity is saturated.
The following standards have been laid down for scale costs:
i. Teacher student ratios
ii. Textbooks to student ratios
iii. Classroom to student ratios
Costs for additional enrolments do not move linearly. They depend on the model used. The simulation uses four models to accommodate new enrolment:
1. Private sector
2. Public-private partnership options and local innovation
3. Public schools with excess capacity
4. Public schools with saturated capacity
For public private-partnership, per child cost is lower than in the case of regular government-run schools because teacher salary and other overheads are not included. Same has been used for local innovation. The local innovation option has been provided in the strategies for access and participation in areas where population density is low, and the traditional school establishment model is not feasible.
The share of each school type in additional enrolment has been included as follows:
Table 15-3 Breakup of each school type in additional enrolment
|
Options |
ECE |
Primary |
Middle |
High/H.S |
ALP/AL |
|
Regular |
50% |
50% |
60% |
70% |
0% |
|
PPP |
30% |
30% |
20% |
20% |
50% |
|
Innovative Model |
20% |
20% |
10% |
10% |
50% |
Initially, enrolment will also be accommodated in schools with excess capacity. These will only entail costs of additional textbooks and examinations.
Non Scale costs do not depend on enrolment and are normally a one-time effort (though not in all cases). These have been calculated separately for each activity based on human and other resources employed. Wherever an activity or strategy entails a non-scale cost, the amount has been shown in the implementation matrix against the specific entry. COVID 19 related strategies have been costed here as they primarily entail development of specific products like videos. The cost of learning pamphlets is in the scale factor as it would be distributed. It has been conflated with the cost of textbooks.
15.3.1. How the Scale Model Works?
School enrolments across various options cannot be filled in a linear or, always, predictable manner. Enrolments may increase in classrooms with no additional capacity even as the excess capacity schools continue at an inefficient rate. The model assumes continuity of low enrolment and inefficiency for at least two years into implementation. Similarly, options of private schools enrolment begin early while PPPs a bit later as the model will take time to settle and become operational.
There are five sources for increased enrolment:
1. Higher intake rate at the ECE level
2. Improved survival rate at the primary level
3. Better transition rate between primary and middle
4. Improved survival rate at the middle and secondary levels
5. Better transition rates between middle and secondary
The improvements are expected to come from a number of strategies:
Increased intake rate at the ECE/Grade 1: This is expected to improve through the expansion of ECE and schooling opportunities at primary levels plus community mobilisation for enhanced enrolments at the right age.
Improved survival rates: Increased survival rates will essentially come from improvements in the quality of learning. Each of the strategies that target improvements in quality will have an impact on survival rates. However, learning improvements may remain slow. There are strategies that may not impact them in the short run, but while others may have an impact even if it is not discernable in early improvements in student learning outcomes.
For example, health screening and school meals may produce more immediate results as compared to changes in curriculum and textbooks. In the absence of specific local research, it is difficult to isolate impacts of each of the strategies separately.
Higher transition rates: Higher transition rates are partially induced by improved survival. Other factors will be increased schooling opportunities beyond primary and middle. The third source will be learners mainstreamed through non-formal basic education programs.
Standards for Regular Public School Enrolments
15.3.2. Standards for Regular Public School Enrolments
Different standards have been used for each level: primary, middle, secondary and higher secondary. For primary a teacher student ratio of 1:40 has been used, for middle, secondary and higher secondary the ratio used is 3:4074.
74 Ideally, the ratio for secondary and higher secondary should be 5:40 but practical considerations of teacher availability and costs have led to reduction of the ratio for costing of BESP.
75 Table 15-11 does not include Medical Education as it is beyond the scope of the sector plan.
Table 15-4 Standard for Student Teacher Ratio
|
Student Teacher Ratio |
||
|
Schools |
Teacher-Student Ratio |
|
|
Primary |
1 |
40 |
|
Middle |
3 |
40 |
|
High |
3 |
40 |
|
Higher Secondary |
3 |
40 |
In case of textbooks, instead of ratios costs of packages for each level has been used. This will increase over the next five years at an inflation rate of 10% for the model overall.
Table 15-5 Textbooks Cost per set
|
Text Books (Cost per set) |
|
|
Primary |
375 |
|
Middle |
625 |
|
High |
800 |
Unit Costs
15.3.3. Unit Costs
Unit costs for the scale component have been used as follows:
1. For construction: standard costs used by the Communications and Works (C&W) Department
2. Teachers: As per the salary structure
3. Textbooks: Based on actual costs of textbooks
4. Inflation: At the rate of 10 percent per annum
Budgetary Impact
15.4. Budgetary Impact
An overall budgetary impact is of Rs. 72.75 billion rupees. Out of these only Rs. 3.27 billion rupees are attributed to non-scale expenditure. This comes to about 4.5% of the total. However, this 4.5% is critical to successful impact of the remaining 95.5%.
Table 15-6 BESP Costing
|
Education Sector Plan |
||||||
|
Additional Budget Requirements (In Billion
PKR.) |
||||||
|
for the Period 2020 – 2025 |
||||||
|
|
Year 1 |
Year 2 |
Year 3 |
Year 4 |
Year 5 |
Total |
|
2020-21 |
2021-22 |
2022-23 |
2023-24 |
2024-25 |
||
|
Recurrent Cost: |
3.95 |
6.48 |
9.90 |
12.05 |
10.50 |
42.88 |
|
ECE |
0.68 |
0.86 |
1.20 |
1.45 |
1.46 |
5.66 |
|
Primary |
1.23 |
1.60 |
2.05 |
2.36 |
2.12 |
9.35 |
|
Middle |
0.68 |
1.28 |
2.27 |
3.25 |
3.62 |
11.09 |
|
High |
0.21 |
0.29 |
0.41 |
0.48 |
0.43 |
1.82 |
|
Higher Sec |
0.04 |
0.08 |
0.10 |
0.09 |
0.06 |
0.37 |
|
NFE/ALP |
0.15 |
0.45 |
0.93 |
1.32 |
1.45 |
4.29 |
|
Adult Literacy |
0.82 |
1.69 |
2.59 |
2.66 |
0.91 |
8.66 |
|
Monitoring |
0.15 |
0.23 |
0.35 |
0.45 |
0.46 |
1.63 |
|
Development Cost: |
2.15 |
6.12 |
7.67 |
8.07 |
5.88 |
29.87 |
|
ECE |
0.53 |
0.62 |
0.70 |
0.70 |
0.53 |
3.09 |
|
Primary |
0.87 |
3.72 |
4.45 |
4.68 |
3.97 |
17.69 |
|
Middle |
0.16 |
0.46 |
0.63 |
0.63 |
0.16 |
2.04 |
|
High |
0.15 |
0.37 |
0.52 |
0.52 |
0.15 |
1.72 |
|
Higher Sec |
0.01 |
0.02 |
0.02 |
0.02 |
0.01 |
0.07 |
|
Adult Literacy |
0.00 |
0.00 |
0.00 |
0.00 |
0.00 |
0.00 |
|
NFE/ALP |
0.16 |
0.35 |
0.57 |
0.62 |
0.30 |
1.99 |
|
Non Scale Cost |
0.26 |
0.57 |
0.78 |
0.89 |
0.76 |
3.27 |
|
Grand Totals |
6.09 |
12.60 |
17.56 |
20.12 |
16.38 |
72.75 |
The budgets are broken into development and recurrent budgets. Development expenditure of each year has an impact on the recurrent expenditure for the following year. For example, schools added in development expenditure in year one will have implications for recurrent expenditure in the next years in terms of teacher salaries and maintenance.
The most significant impact can be seen in the primary and middle levels with the expectations that over the next five years survival and transition rates will improve at these two levels and subsequent increase will be possible in the subsequent years in the secondary and higher secondary levels.
Commitments from Development Partners
15.5. Commitments from Development Partners
Table 15-7 below shows the commitments from development partners for the next five years. These include major commitments of 18 million euros and dollars from the European Union and the World Bank (WB) respectively.
Table 15-7 Commitments from development partners
|
Sr.
No. |
Donors/Local
Partners/International Partners/NGOs/etc. |
Currency |
Budget in Euro/US $ Million |
Total
Pak Rs. In
Million |
|
1 |
UNICEF |
USD |
0.00 |
0.000 |
|
2 |
World Bank |
USD |
18.00 |
2,772.000 |
|
3 |
European Union |
EUR |
18.00 |
3,024.000 |
|
4 |
UNESCO (Malala Fund) |
USD |
0.139 |
21.406 |
|
5 |
JICA |
USD |
1.16 |
178.640 |
|
|
Total |
PKR |
|
5,996.046 |
|
|
PKR in billion |
PKR |
|
5.996 |
|
Source: PPIU |
||||
The World Bank (WB) funding will target 4 districts with refugee presence. Japan International Cooperation Agency (JICA) funds are targeted at Literacy and Non-formal Education.
Calculating Budgetary Gaps
15.6. Calculating Budgetary Gaps
Table 15-11 shows the financing gap if the current budgetary trends continue in the government. It is at 30% of the requirements after accounting for government commitments and expected, committed, donor funds.
Ideally growth rates and predictions should be undertaken on the basis of Gross Domestic Product (GDP). However, as the provincial government does not calculate Gross Domestic Product (GDP) budgetary trends have been used as proxy. Table 15-8 shows ten-year budgetary trend of the overall provincial budget.
Table 15-8 Ten Year Trend of Provincial Budget - Balochistan
|
Ten Year Trend of Provincial Budget |
||||||
|
|
Provincial Budget |
Percentage Growth |
||||
|
Year |
Current |
Development |
Total |
Annual % for recurrent |
Development |
Total |
|
BE2010-11 |
125.26 |
26.33 |
151.59 |
|
|
|
|
BE2011-12 |
133.21 |
31.35 |
164.56 |
6% |
19% |
9% |
|
BE2012-13 |
144.11 |
35.82 |
179.93 |
8% |
14% |
9% |
|
BE2013-14 |
154.48 |
43.91 |
198.40 |
7% |
23% |
10% |
|
BE2014-15 |
164.97 |
50.74 |
215.71 |
7% |
16% |
9% |
|
BE2015-16 |
189.02 |
54.51 |
243.53 |
15% |
7% |
13% |
|
BE2016-17 |
218.17 |
71.18 |
289.35 |
15% |
31% |
19% |
|
BE2017-18 |
242.49 |
86.01 |
328.50 |
11% |
21% |
14% |
|
BE2018-19 |
264.04 |
88.25 |
352.29 |
9% |
3% |
7% |
|
BE2019-20 |
293.58 |
126.34 |
419.92 |
11% |
43% |
19% |
|
Ten Year Average % |
|
|
|
10% |
20% |
12% |
|
Five Year Average % |
|
|
|
12% |
21% |
14% |
|
Source: Budget
Books 2010-11 to 2019-20 |
||||||
Over a ten year period, the recurrent expenditure has had an average increase of 10% and the development budget 20% and an overall average increase of 12%. For the last five years, the average increase of recurrent budget is 12%, development budget 21% and recurrent budget at 14%, Table 15-9 shows trend of Balochistan’s education budget over the same period.
Table 15-9 Ten Year Trend of Balochistan's Education Budget
|
Ten Year Trend of Balochistan's Education
Budget |
||||||
|
|
Balochistan Education Budget |
Percentage Growth |
||||
|
Year |
Current |
Development |
Total |
Annual % for recurrent |
Development |
Total |
|
BE2010-11 |
17.32 |
2.28 |
19.60 |
|
|
|
|
BE2011-12 |
19.24 |
2.80 |
22.04 |
11% |
23% |
12% |
|
BE2012-13 |
22.46 |
2.36 |
24.82 |
17% |
-16% |
13% |
|
BE2013-14 |
24.74 |
10.54 |
35.28 |
10% |
347% |
42% |
|
BE2014-15 |
28.94 |
11.74 |
40.67 |
17% |
11% |
15% |
|
BE2015-16 |
38.33 |
10.02 |
48.34 |
32% |
-15% |
19% |
|
BE2016-17 |
42.63 |
6.65 |
49.28 |
11% |
-34% |
2% |
|
BE2017-18 |
45.90 |
9.60 |
55.50 |
8% |
44% |
13% |
|
BE2018-19 |
56.27 |
12.45 |
68.72 |
23% |
30% |
24% |
|
BE2019-20 |
62.43 |
12.68 |
75.11 |
11% |
2% |
9% |
|
Ten Year Average % |
|
|
|
16% |
44% |
17% |
|
Five Year Average % |
|
|
|
17% |
6% |
13% |
|
Source: Budget
Books 2010-11 to 2019-20 |
||||||
Both the ten year and five year, averages for percentage growth show that the growth rate of education budget has been more than the overall education budget in the ten year period. It slows down a bit in the last five years due to lower average percentage of development budget. In the ten year average recurrent budget increases by 16%, development budget by 44% and total by 17%. In the last five years, recurrent expenditure has grown by 17% on average and while development budget has had an average growth of only 6% per annum. Overall average per year growth rate being 13%.
Based on the above Table 15-10 shows the percentage growths of provincial budgets that can be committed in routine by the Government of Balochistan.
Table 15-10 percentage growths of provincial budgets committed
|
Increase committed based on past trend for
5 years |
|
|
Recurrent |
12% |
|
Development |
6% |
Recurrent increase has been committed at 12% although the average for last five years is 16%. Given the natural increments (based on regular salary increases) a 5% increase in the recurrent budget has been estimated. This means if new personnel are not recruited the recurrent budget would still increase by 5%. Hence, for additional funds for BESP the recurrent component growth rate is projected at 12%.
Table 15-11 Analysis of Finances Gap
|
Analysis of Finances Gap |
|||||||
|
Budget |
Base Year |
Year
1 |
Year
2 |
Year
3 |
Year
4 |
Year
5 |
Total |
|
Secondary Education Department
(Recurring) |
48.01 |
52.81 |
58.09 |
63.90 |
70.29 |
77.32 |
322.43 |
|
Secondary Education Department
(Development) |
6.48 |
7.12 |
7.84 |
8.62 |
9.48 |
10.43 |
43.49 |
|
Higher Education (Recurring) |
10.13 |
11.14 |
12.26 |
13.48 |
14.83 |
16.32 |
68.03 |
|
Social Welfare Department (Recurrent
Budget-NFE, Special Edu and Child Protection) |
0.60 |
0.66 |
0.73 |
0.80 |
0.88 |
0.97 |
4.03 |
|
Industries Department (Recurring – TVET) |
0.57 |
0.63 |
0.69 |
0.76 |
0.83 |
0.92 |
3.82 |
|
Labour & Manpower (Recurring – TVET) |
1.26 |
1.39 |
1.53 |
1.68 |
1.85 |
2.03 |
8.48 |
|
Mines and Minerals (Recurring -
Education) |
0.15 |
0.16 |
0.18 |
0.20 |
0.22 |
0.24 |
0.99 |
|
Total Education Budget 2019-20 |
67.20 |
73.92 |
81.31 |
89.44 |
98.39 |
108.23 |
451.29 |
|
BESP Proposed Budget |
|
6.09 |
12.60 |
17.56 |
20.12 |
16.38 |
72.75 |
|
Government Commitment |
|
6.09 |
8.44 |
9.29 |
10.22 |
11.24 |
45.28 |
|
Development Partners |
|
0.00 |
1.20 |
1.80 |
1.80 |
1.20 |
6.00 |
|
Gap |
|
0.00 |
2.96 |
6.48 |
8.10 |
3.94 |
21.48 |
|
Percentage increase required in routine
budget |
|
0% |
4% |
10% |
12% |
6% |
32% |
|
Deficit percentage of BESP amount |
|
0% |
23% |
37% |
40% |
24% |
30% |
Table 15-11 shows that an overall gap of Rs. 21.48 billion will remain till the end year five if alternative options from development partners or increased commitments from the government are not received75. Government of Balochistan is committed to covering this gap through additional allocations based. The latter will depend on political support to education and the revenue positions of the federal and provincial governments. This has been discussed in the next section.
75 Table 15-11 does not include Medical Education as it is beyond the scope of the sector plan.
15.7. Program Wise Commitment
15.7. Program Wise Commitment
Table 15-12 shows program wise requirements, commitments and financial gaps. These include the commitments possible from the provincial government as per current projects and also support from development partners.
Table 15-12 Program Wise Budget Required and Committed
|
Program
Wise Budget Required and Committed Figures
in PKR. Million |
||||||
|
Program |
Estimated Cost Non- Scale Factor |
Scale Factor |
Total |
Committe d from GOB |
Development Partner Contribution |
Gap |
|
1- Learning Design |
140.77 |
369.85 |
520.62 |
510.62 |
0.00 |
0.00 |
|
2- Effective Teachers |
165.27 |
6,685.63 |
6,865.90 |
5,280.19 |
2,923.20 |
-1,352.49. |
|
3- Assessments and Examinations |
210.07 |
6,967.15 |
7,182.22 |
6,581.61 |
428.40 |
167.21 |
|
4- Child Care and Welfare |
175.50 |
4,753.22 |
4,933.72 |
3,930.04 |
0.00 |
998.68 |
|
5- Access and Participation |
1,422.30 |
29,521.43 |
30,948.73 |
17,439.35 |
1,208.05 |
12,296.33 |
|
6- Data and Research |
305.09 |
6,721.17 |
7,026.26 |
3,469.00 |
428.40 |
3128.86 |
|
7- Governance and Management |
763.26 |
14,465.25 |
15,228.51 |
7,979.76 |
1,008.00 |
6,240.75 |
|
8- Technical and Vocational Education and
Training |
46.26 |
0.00 |
46.26 |
86.26 |
0.00 |
0.00 |
|
|
3,268.52 |
69,483.70 |
72,752.22 |
45,276.83 |
5,996.05 |
21,479.34 |
Challenge and Sustainability
15.8. Challenge and Sustainability
Government of Balochistan (GOB) and Secondary Education Department (SED) recognise that financing the gap will be challenging, especially, given ongoing increase in regular education budget. Balochistan’s own resources are mainly received from the federal government through its share of the National Finance Commission award (See Table 15-13). Only 9% of the budget is raised from provincial sources.
Table 15-13 Provincial Budget Statement 2019-20
|
Provincial Annual Budget Statement 2019-20 |
|||
|
Amount in Billions of Rupees |
|||
|
|
|
Receipts |
Percentage Share |
|
1 |
Federal Receipts |
328 |
88% |
|
2 |
Provincial Receipts |
34 |
9% |
|
3 |
Other |
10 |
3% |
|
|
Source:
Balochistan Provincial Budget 2019-20 |
||
The second challenge will come from the current situation of the Federal Government with the latter in the throes of a restructuring program where there have been reductions in actual transfers to the provinces. For at least the next two years, the trend will continue. Things are expected to improve by year 3 of the sector plan implementation.
The figure given for development partners has been based on the current commitments. More is being negotiated, but the commitments are not known. With the sector plan in place, the government will be in a better position to attract and negotiate funds from various sources, including, development partners.
The government expects to meet the gaps through the following approaches:
i. Increased support from development partners
ii. Higher expectations of provincial revenue
At the time of the previous Sector Plan the government had leveraged BESP for increased funding from the development partners. With some success in the bag and a more robust Sector Plan the government expects a better response. A more proactive approach to engage the Economic Affairs Division and larger development partners will be used.
There is a likelihood of improvement due to the recently established Balochistan Revenue Authority (BRA). The authority, as compared to the older Excise and Taxation Department (ETD), has been receiving capacity development support from the European Union (EU) and the World Bank (WB). Additionally, it has a wider scope for taxes on services.
Most critically the Government of Balochistan (GoB) and Secondary Education Department (SED) are committed to manage their resources more efficiently. The Plan recommends, and the subsequent simulation model assumes, that existing resources will be rationalised for optimal return. This will mean new resources (including human resource) do not need to be acquired unless necessary till the present set is deployed more efficiently. A focus on learning will improve the efficiency but in the long run though some aspects can bring early results. The key will be efficiency through improved governance for better value for money that may lower the financial needs even below the levels identified in the BESP. This will include as rationalisation of resources as a key step. An example is better deployment of primary school teachers will reduce single teacher schools drastically without additional employment. Similarly, for enrolment initial effort will be to fill in the existing spaces in schools before embarking on new constructions.
In addition to the above it is important to understand that Balochistan has a broken education system where major investments are required in access and participation, as well as, learning. The current pattern of expenditure, if followed strictly, will not achieve the desired change and shift in the results. Therefore budget outlays of the BESP have not been restricted to a path constrained by past trends alone. The Plan itself is an instrument for negotiation of more funds and the gaps can be filled in with better demonstration of implementation and more clarity in the direction – BESP provides the guide to the latter.
Secondly, the financing gap appears large in terms of percentages but is actually not unreachable in real terms. An amount of Rs. 21.48 billion spread over five years. The highest gap is in year 4 at Rs. 8.1 billion. This is not beyond the government’s capacity provided education performs and remains a priority.
Key Assumptions for Financing
15.9. Key Assumptions for Financing
Successful provision of finances for the sector plan depend on the same factors that will require effective implementation:
Continued across the board political support: Secondary Education Department (SED) will continue to engage with political leadership as planned in BESP.
Continued Prioritisation of Education: Over the last 10 years the growth rate of education budget has been greater than that for the overall provincial budget. Given the increased political value of education across the country, especially, since it has been devolved to the provinces in 2009 the political priority of education will continue.
Capacity development of SED: Capacity building is an ongoing process of the sector plan and with increased capacity efficiency in expenditure is also expected to improve.
Strict Monitoring Regime: Learning from mistakes of the past the monitoring regime provided in the BESP will be more strictly followed than in the past.
Better Capacity of PPIU: In 2013 Policy Planning and Implimentation Unit (PPIU) was a new and relatively small organisation. Since then it has improved its capacity in terms of numbers as well as skill sets available with the organisation. More capacity will be built in the next 6 months as part of implementation of BESP. Policy Planning and Implimentation Unit (PPIU) now also has a more engaged approach to interaction with development partners.


No comments:
Post a Comment